—
Introduction: The Quiet Revolution in Environmental Data
Imagine standing in a remote forest, surrounded by the sounds of wildlife, yet you have no idea how the air quality, soil moisture, or temperature are changing in real time. For decades, scientists relied on sporadic manual sampling, limited to a handful of stations that could hardly capture the complexity of ecosystems. Today, that narrative is shifting dramatically—thanks to field environmental monitoring nodes. These compact, sensor‑laden devices are the backbone of the new era of precision conservation, enabling researchers, policymakers, and land managers to collect high‑resolution data, spot trends early, and make informed decisions faster than ever before.
In this post, we’ll dive deep into what field environmental monitoring nodes are, how they’re built, where to deploy them, and how to turn raw data into actionable insights. Whether you’re a seasoned ecologist or a curious citizen scientist, this guide will help you harness the full potential of environmental monitoring technology.
1. What Exactly Is a Field Environmental Monitoring Node?
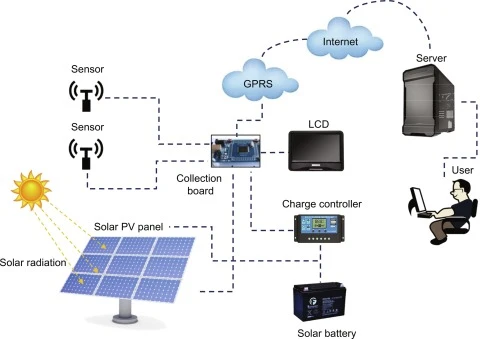
A field environmental monitoring node (often shortened to “monitoring node” or “sensor node”) is a self‑contained unit equipped with multiple sensors, a power source, and a communication module. Think of it as a mini laboratory that can be planted in a forest, installed on a cliff face, or anchored in a riverbank—capable of recording environmental parameters continuously and transmitting that data to a central server for analysis.
Key Functions
| Function | Description |
|———-|————-|
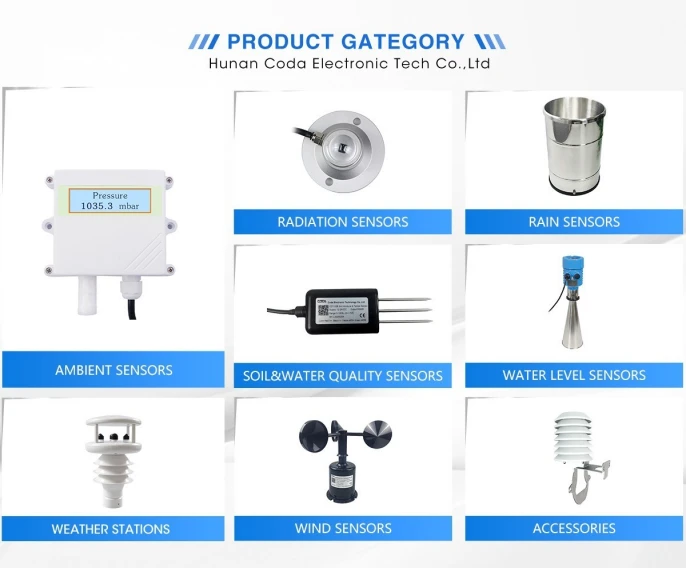
| Sensing | Measures variables such as temperature, humidity, light, soil moisture, wind speed, and more. |
| Processing | Local microcontroller aggregates data, performs basic filtering, and prepares packets for transmission. |
| Communication | Uses wireless protocols (LoRa, NB‑IoT, satellite, cellular) to send data to the cloud or a local gateway. |
| Power Management | Solar panels, batteries, or energy harvesting modules keep the node operational in the field. |
Why They Matter
- Spatial Coverage: Deploying dozens or hundreds of nodes across a landscape gives a fine‑grained picture that single weather stations can’t provide.
- Temporal Resolution: Continuous sampling (often every minute or hour) captures diurnal cycles and sudden events like storms or heatwaves.
- Cost‑Effectiveness: Once set up, nodes run autonomously, reducing labor costs associated with manual sampling.
—
2. Building Blocks: Key Components & Sensors
Understanding the anatomy of a monitoring node helps you choose the right hardware for your project and ensures reliability in the field.
2.1 Microcontroller & Firmware
- Popular Choices: ESP32, Arduino MKR series, Raspberry Pi Zero W.
- Why It Matters: The microcontroller must balance low power consumption with enough processing power to handle multiple sensor streams and communication protocols.
2.2 Sensor Suite
| Parameter | Typical Sensors | Notes |
|———–|—————–|——-|
| Temperature & Humidity | DHT22, SHT35 | Good accuracy; low power. |
| Air Quality | MQ‑135, CCS811 | Detects VOCs, CO₂, and general air pollutants. |
| Soil Moisture | Capacitive probes (e.g., Decagon 5TE) | Avoids corrosion; measures volumetric water content. |
| Light | Photodiodes or PAR sensors | Useful for photosynthetic activity studies. |
| Wind | Anemometers (e.g., Adafruit Wind Speed Sensor) | Important for microclimate studies. |
| Barometric Pressure | BMP280, BME680 | Helps estimate altitude and weather fronts. |
2.3 Power System
- Solar Panels: 5–10 W panels are common for nodes in open areas.
- Battery: Li‑Po or Li‑FePO₄ cells; capacity depends on power budget and expected downtime.
- Power Management ICs: TPS series from TI or LTC series from Analog Devices help regulate voltage and monitor battery health.
2.4 Communication Modules
| Protocol | Pros | Cons |
|———-|——|——|
| LoRaWAN | Long range, low power | Requires a gateway; data rate limited |
| NB‑IoT | Cellular coverage, low power | Depends on carrier; higher cost |
| Satellites (e.g., Iridium) | Truly global | Expensive, limited data rate |
| Wi‑Fi | High bandwidth | Limited range; higher power |
2.5 Enclosure & Mounting
- Durability: IP65 or higher to withstand rain, dust, and wildlife.
- Thermal Management: Heat sinks or ventilation to avoid overheating in hot climates.
- Mounting: Adjustable brackets or tripod bases allow for precise orientation of directional sensors.
—
3. Deployment Strategies & Best Practices
A well‑designed deployment plan is as crucial as the hardware itself. Here’s how to get your nodes off the ground—literally—and running smoothly.
3.1 Site Selection
- Representativeness: Choose sites that capture the heterogeneity of your study area (e.g., canopy vs. understory, wet vs. dry zones).
- Accessibility: Ensure that nodes can be maintained or replaced without excessive risk or cost.
- Security: Protect against vandalism or wildlife damage; consider camouflage or protective cages.
3.2 Network Architecture
- Star vs. Mesh: LoRaWAN often uses a star topology with gateways; mesh networks (e.g., Zigbee) can extend coverage but add complexity.
- Gateway Placement: Place gateways to maximize line‑of‑sight and minimize interference; use directional antennas if necessary.
- Bandwidth Planning: Calculate data volume per node and ensure your chosen protocol can handle peak loads.
3.3 Power Management
- Duty Cycling: Program sensors to sleep between readings; adjust sampling frequency based on research needs.
- Battery Life Estimation: Use tools like the TI Power Calculator to model worst‑case scenarios (e.g., cloudy periods for solar).
- Redundancy: Install spare batteries or backup panels in critical nodes.
3.4 Calibration & Validation
- Pre‑Deployment Calibration: Use reference instruments to calibrate sensors before installation.
- In‑Field Validation: Periodically compare node readings with portable handheld devices or nearby weather stations.
- Drift Monitoring: Implement automated drift detection algorithms that flag anomalous sensor behavior.
3.5 Data Security
- Encryption: Use TLS or DTLS for data transmission.
- Access Controls: Limit API keys and gateway credentials.
- Audit Trails: Log firmware updates and maintenance events.
—
4. Turning Data Into Insight: Management & Analytics
Collecting data is just the first step. The real value lies in turning raw numbers into actionable knowledge.
4.1 Data Pipeline Overview
1. Collection: Sensors send data to gateways.
2. Ingestion: Gateways forward data to a cloud platform (AWS IoT, Azure IoT Hub, Google Cloud IoT).
3. Storage: Time‑series databases (InfluxDB, TimescaleDB) or object storage (S3) hold raw data.
4. Processing: ETL jobs clean, aggregate, and enrich data.
5. Analytics: Machine learning models or statistical scripts analyze trends.
6. Visualization: Dashboards (Grafana, Power BI) provide real‑time insights.
4.2 Quality Assurance
- Missing Data Handling: Use interpolation or imputation techniques to fill gaps.
- Outlier Detection: Apply Z‑score or DBSCAN algorithms to flag sensor malfunctions.
- Metadata Management: Keep detailed logs of node location, sensor type, and calibration status.
4.3 Analytical Use Cases
| Use Case | What You Gain | Example Tools |
|———-|—————|—————|
| Climate Change Monitoring | Detect long‑term temperature and precipitation trends | R, Python (pandas, matplotlib) |
| Wildfire Risk Assessment | Identify hotspots and dry conditions | GIS (QGIS), machine learning |
| Water Quality Monitoring | Track dissolved oxygen, pH, and turbidity | LabVIEW, MATLAB |
| Biodiversity Support | Correlate microclimate with species presence | eBird, iNaturalist integration |
4.4 Decision Support
- Automated Alerts: Set thresholds (e.g., soil moisture < 10%) to trigger SMS or email notifications.
- Adaptive Sampling: Use AI to increase sampling frequency during anomalous events.
- Reporting: Generate periodic reports for stakeholders, ensuring transparency and compliance.
—
5. Future Trends & Innovations
Field environmental monitoring nodes are evolving rapidly. Staying ahead of the curve can give your projects a competitive edge.
5.1 Energy Harvesting Beyond Solar
- Kinetic Harvesters: Capture energy from wind or water flow.
- Thermal Generators: Convert temperature gradients into power.
5.2 Edge Computing
- On‑node Analysis: Process data locally to reduce bandwidth and enable instant decision‑making.
- Federated Learning: Train models across multiple nodes without transmitting raw data.
5.3 Swarm Robotics
- Autonomous Deployment: Drones or ground robots can place nodes in hard‑to‑reach areas.
- Self‑Repair: Robots that can replace faulty nodes on the fly.
5.4 Integration with Satellite Data
- Data Fusion: Combine ground‑based node data with satellite imagery for multi‑scale analysis.
- Cloud‑Based Analytics: Use AI models hosted on cloud platforms to interpret complex patterns.
—
Conclusion: Key Takeaways
1. Field environmental monitoring nodes are the new microscopes of the environment, giving researchers unprecedented spatial and temporal resolution.
2. Choosing the right hardware—microcontroller, sensors, power, and communication—sets the foundation for reliable data collection.
3. Strategic deployment—site selection, network design, power management, and calibration—ensures long‑term operability.
4. A robust data pipeline transforms raw sensor outputs into actionable insights, supporting real‑time monitoring and decision support.
5. Emerging technologies like edge computing, energy harvesting, and swarm robotics promise to push the boundaries of what’s possible in the near future.
By investing in a well‑planned monitoring node network, you can unlock the hidden stories of your ecosystems, safeguard biodiversity, and contribute valuable data to the global scientific community. Whether you’re a research team, a conservation NGO, or an engaged citizen, the tools are now within reach—so start building your environmental monitoring node today and be part of the data revolution that will shape our planet’s future.
—